
U.S. Commercial Truck Retirement & Scrappage Study
Executive Summary
In trucking, “retirement” is rarely a single event. A Class 8 tractor typically passes through several owners and progressively lighter duty cycles before it is finally dismantled for parts and scrap metal. This study pulls together the best available public and industry data to explain how big the U.S. commercial truck fleet is, how fast it is aging, how trucks exit the fleet, and what forces speed up or delay that exit.
Key findings at a glance:
The U.S. heavy truck fleet is large and growing.
About 13.5 million heavy trucks were registered in the U.S. in 2020, and heavy trucks and buses accounted for roughly 11% of the 2.9 trillion vehicle miles driven that year (ORNL Transportation Energy Data Book).
Vehicles are staying on the road longer than ever.
The average U.S. light vehicle reached a record 12.8 years of age in 2025, with the total fleet at 289 million vehicles and a steady annual scrappage rate of about 4.5% (S&P Global Mobility). Research on U.S. registration data finds vehicle longevity has been increasing at roughly 0.5% to 1.5% per year for decades.
Trucks outlive cars by a wide margin.
Classic scrappage research found light trucks had a median lifetime of about 14.5 years versus 9.9 years for passenger cars, and heavy diesel trucks last longer still, often serving 15 to 30 or more years across multiple owners.
Scrappage is economically sensitive
When new truck sales fall, owners delay scrapping older vehicles. EPA fleet modeling documented exactly this pattern after the 2008 recession, and industry analysis estimates that unusually low scrappage from 2018 through 2023 left roughly 11 million additional cars and light trucks on U.S. roads.
Not every “retired” truck is scrapped
A meaningful share of vehicles that leave U.S. registration records are exported rather than destroyed. Academic work based on Census trade data puts used vehicle exports at roughly 5% of measured fleet exits.
There is no single official “trucks scrapped per year” statistic.
Analysts estimate commercial truck retirements by triangulating registration data, new sales, survival curves, and trade data. This study explains that method so readers can use the numbers correctly.
Methodology
There is no single government dataset that reports the number of commercial trucks scrapped each year. This study therefore uses the triangulation approach standard among fleet analysts:
- Fleet stock data. Counts of trucks in operation and their age structure come from the Oak Ridge National Laboratory (ORNL) Transportation Energy Data Book (Edition 40), which compiles federal registration statistics, and from S&P Global Mobility (formerly IHS Markit/R.L. Polk), whose vehicles-in-operation and scrappage figures are derived from actual state registration records. The Census Bureau’s 2021 Vehicle Inventory and Use Survey (VIUS), a sample of 150,000 trucks and the first such survey since 2002, provides physical and usage characteristics including vehicle age and lifetime mileage.
- Flow data. New truck sales and used truck market indicators (price, age, mileage of trucks sold) come from industry sources such as ACT Research, which maintains Class 8 market data back to 1996.
- Survival and scrappage models. Truck survival curves are drawn from the ORNL Data Book’s heavy truck scrappage and survival tables and from the peer-reviewed scrappage literature. EPA’s MOVES model documentation and NREL’s heavy-duty vehicle module, both of which build fleet turnover on these survival functions, are used to validate the approach.
- Leakage adjustment. Because a vehicle disappearing from U.S. registrations may have been exported rather than scrapped, export estimates from academic work using Census Bureau trade statistics are used to separate true scrappage from exports
- Limitations. Readers should note three caveats. First, the most detailed published heavy truck survival tables are based on older model years (1970, 1980, and 1990), and modern trucks are lasting longer, so historical curves understate today’s lifetimes. Second, the widely cited 4.5% scrappage rate refers to light vehicles (cars, pickups, SUVs); class-specific scrappage rates for Class 3-8 trucks are held in commercial datasets and vary by class and freight cycle. Third, registration-based methods count a truck as “gone” when it leaves the records, which mixes scrappage, export, and idling. Where a number applies to light vehicles rather than commercial trucks, this study says so explicitly.
Finding 1: A Large Fleet That Keeps Getting Older
The U.S. had approximately 13.5 million heavy trucks registered in 2020, according to the ORNL Transportation Energy Data Book. Together with buses, these vehicles accounted for about 11% of the 2.9 trillion vehicle miles driven in the U.S. that year, and Class 7-8 trucks alone consumed roughly 2.4 million barrels of petroleum per day in 2019, about 12% of total U.S. petroleum use.
The fleet supporting all that work is aging. S&P Global Mobility’s registration-based analysis shows the average U.S. light vehicle reached a record 12.8 years in 2025, the result of high new vehicle prices, durable modern drivetrains, and the sales disruptions of 2020-2022. Passenger cars now average 14.5 years, while light trucks average 11.9 years.
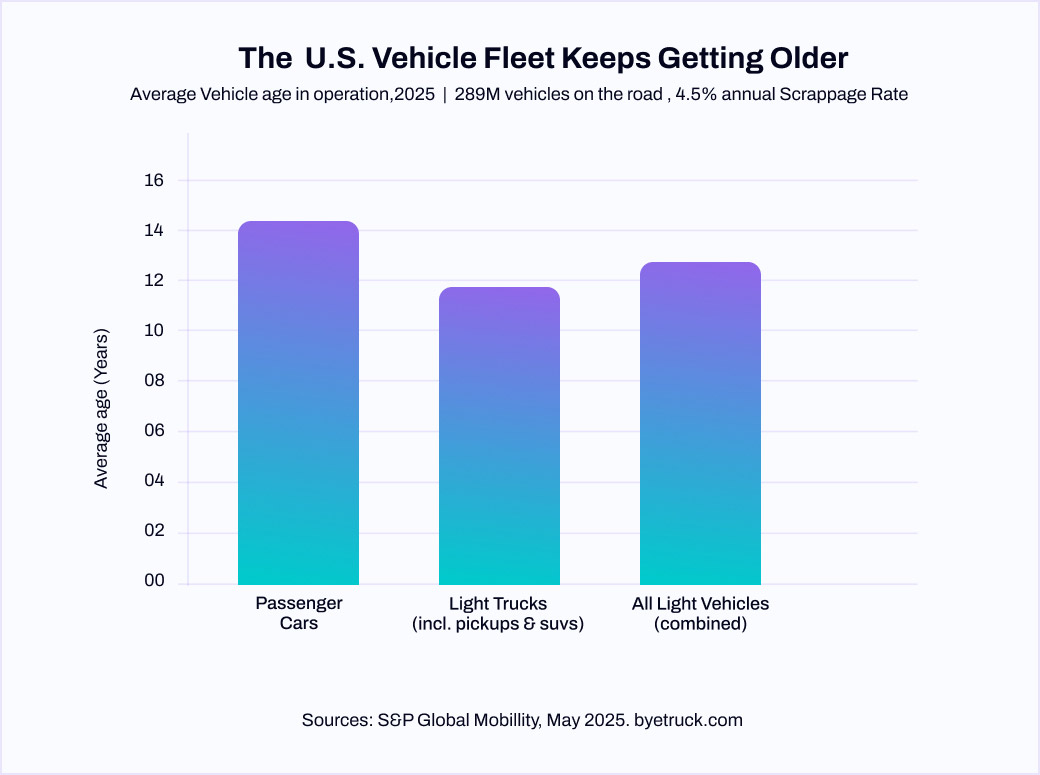
Longevity growth is not new. A 2024 study of complete U.S. registration data found vehicle longevity has been rising at a steady 0.5% to 1.5% per year for decades, and that trucks consistently outlast cars. The classic benchmark from scrappage research is that light trucks historically posted a median lifetime of about 14.5 years versus 9.9 years for cars. Heavy diesel trucks stretch further still: with mid-life engine overhauls, a Class 8 tractor commonly works 15 to 30 or more years across several owners before final dismantling, which is why the ORNL Data Book tracks heavy truck survival separately from cars and light trucks.
For anyone selling, buying, or scrapping used trucks, the takeaway is simple: the pool of old trucks on U.S. roads is larger than at any point in modern history, and each truck spends more years in the “aging” phase where maintenance costs climb, and retirement decisions loom.
Finding 2: Trucking Activity Has Quadrupled, and So Has the Future Retirement Pipeline
Every truck put into service is a future retirement. One clean way to see the long-run growth of trucking activity is fuel consumption by truck class, tracked continuously since 1970 by the ORNL Data Book.
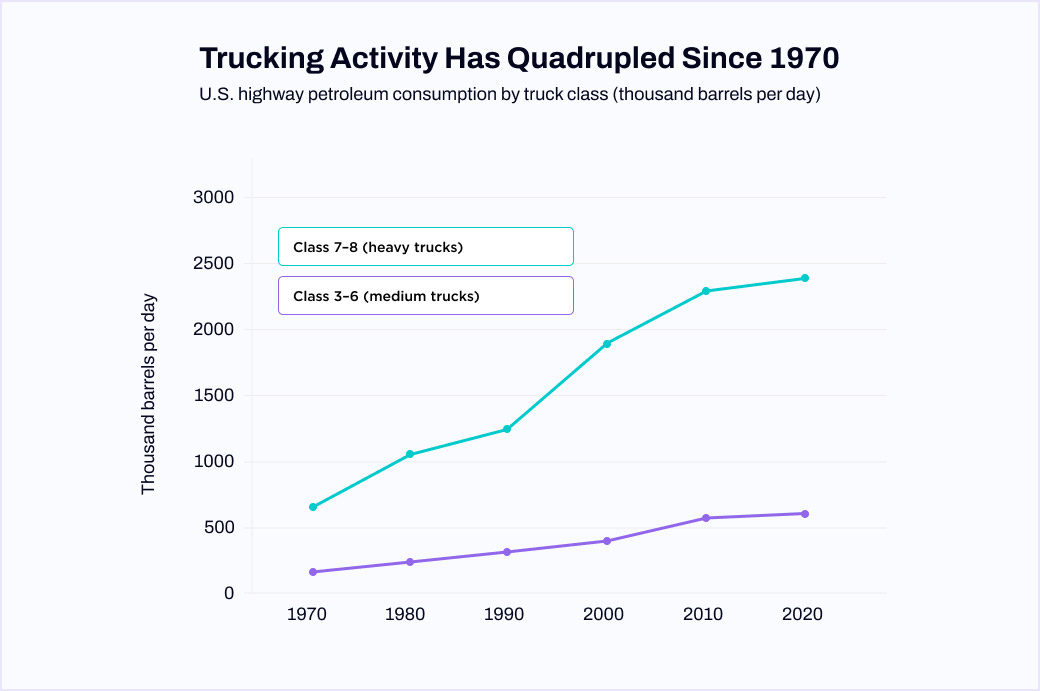
Class 7-8 heavy truck fuel use roughly quadrupled from 598 thousand barrels per day in 1970 to about 2,412 thousand in 2019, with medium-duty Class 3-6 trucks quadrupling as well. (FHWA revised its estimation methodology in 2007, so the series is not perfectly continuous, but the long-run trend is unmistakable.)
The commercial fleet is still expanding. S&P Global Mobility reported that new U.S. commercial vehicle registrations grew about 14% in 2023, with Class 8 registrations up 8% and strong growth in last-mile delivery classes. Today’s registration boom is tomorrow’s retirement wave: the heavy sales years of 2015-2019 are now moving into the prime maintenance and, soon, disposal window.
Finding 3: Retirement Is a Process, Not an Event
When a truck leaves its first owner, it almost never goes straight to the shredder. The typical path runs through the used truck market, often more than once.
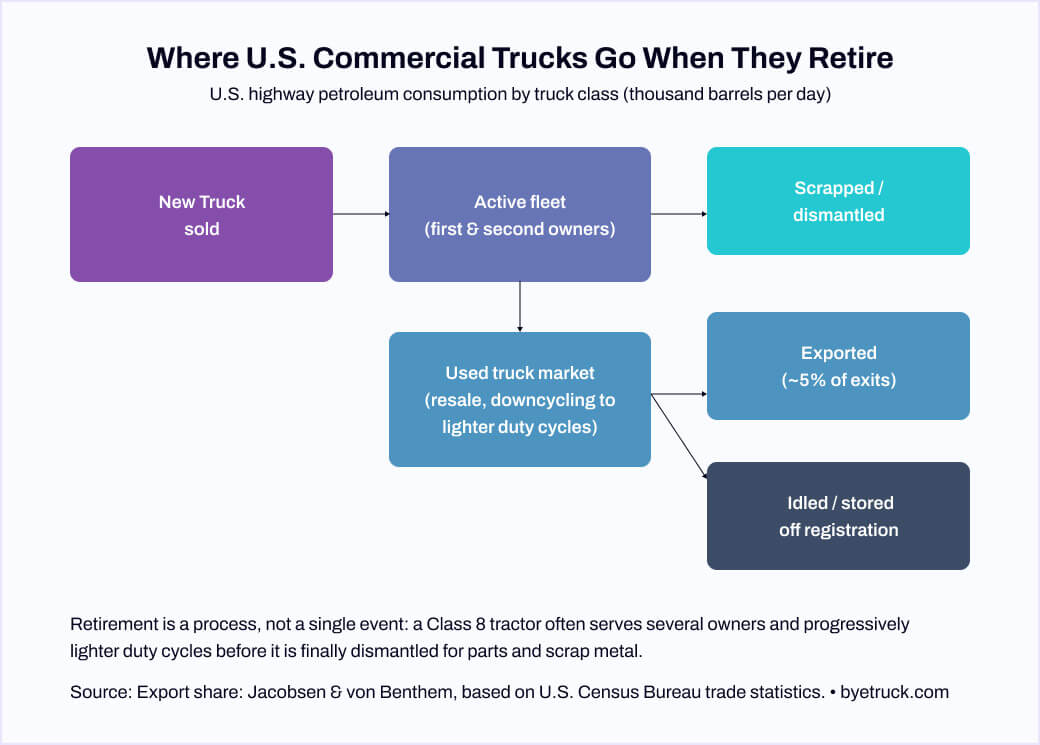
Three exits matter:
Scrappage and dismantling.
The end state for most trucks. Dismantlers recover highvalue components (engines, transmissions, axles, aftertreatment systems) before the hulk is recycled for steel and aluminum.
Export.
A vehicle that vanishes from U.S. registration data may simply be working abroad. Research by economists Jacobsen and van Benthem, using U.S. Census Bureau statistics, found used vehicle exports averaged about 390,000 per year, roughly 5% of total measured fleet exits. Used Class 8 tractors and medium-duty trucks flow in significant numbers to Latin America, Africa, and other markets where U.S. equipment retains value long after it is uneconomical here.
Idling and storage.
Some trucks sit unregistered on lots or farms for years, neither working nor scrapped. Registration-based statistics cannot distinguish these from scrapped vehicles until they either return or are dismantled.
The same research also shows scrappage responds to prices: when used vehicle values rise, fewer vehicles get scrapped. Notably, older pickups showed the most inelastic (stubborn) scrap behavior of any vehicle class, a pattern familiar to anyone who has tried to buy a used work truck.
Finding 4: Scrappage Is a Decision, and the Economy Makes It
Scrappage rates are not a constant. They move with new vehicle prices, used values, freight demand, and regulation.
- Recessions delay scrappage. EPA’s MOVES fleet model documentation shows that the collapse in new vehicle sales after 2008 was accompanied by a measurable delay in the scrappage of older vehicles: owners kept aging equipment running because replacements were unaffordable. The same dynamic repeated after 2020. Lang Marketing estimates that from 2018 through 2023, annual scrappage rates ran about one-sixth below the prior 15-year average, leaving nearly 11 million cars and light trucks on the road that would otherwise have been junked. S&P data similarly show more than 27 million passenger cars leaving the U.S. fleet since 2020 while only about 13 million new ones were registered, reshaping the age mix.
- Regulation accelerates scrappage. The clearest counterforce is policy. California’s Truck and Bus Regulation and its drayage truck rules at the Ports of Los Angeles and Long Beach forced early retirement of older diesel trucks, and EPA’s Diesel Emissions Reduction Act (DERA) grants fund verified scrappage nationwide. Federal emissions standards for heavy-duty engines also shape retirement indirectly: fleets historically “pre-buy” trucks ahead of costly new standards and run older equipment longer afterward.
- For truck owners, the practical signal is the used market. ACT Research’s Class 3-8 used truck data (sales volumes, average price, mileage, and age) is the industry’s real-time gauge. When used values are high, selling an aging truck beats scrapping it; when values slump and repair bills mount, scrappage volumes rise. Timing the exit is worth real money
Key Statistics Table
U.S. Truck Retirement & Scrappage: Key Statistics
The numbers behind the study, in one place
| Metric | Value | Year | Source |
|---|---|---|---|
| Heavy trucks registered in the U.S. | ~13.5 million | 2020 | ORNL TEDB Ed. 40 |
| Share of U.S. vehicle miles, heavy trucks & buses | ~11% of 2.9 trillion miles | 2020 | ORNL TEDB Ed. 40 |
| Class 7-8 petroleum use | ~2.4 million barrels/day | 2019 | ORNL TEDB Ed. 40 |
| U.S. vehicles in operation (all light vehicles) | 289 million | 2025 | S&P Global Mobility |
| Annual light vehicle scrappage rate | ~4.5% | 2025 | S&P Global Mobility |
| Average light vehicle age (record) | 12.8 years | 2025 | S&P Global Mobility |
| Commercial vehicle registration growth | +14% (Class 8: +8%) | 2023 | S&P Global Mobility |
| Median lifetime, light trucks vs. cars | 14.5 vs. 9.9 years | 1966–1977 | Greene & Chen |
| Long-run growth in vehicle longevity | +0.5% to +1.5% / year | multi-decade | Greene et al. 2024 |
| Used vehicle exports as share of fleet exits | ~5% (~390,000 /yr) | study period | Jacobsen & Van Benthem |
| Vehicles “saved” by low scrappage | ~11 million | 2018–2023 | Lang Marketing |
| VIUS 2021 survey sample | 150,000 trucks | 2021 | U.S. Census Bureau |
Conclusion
The U.S. commercial truck fleet is bigger, older, and longer-lived than ever. Retirement is best understood as a multi-stage economic process: trucks cascade down through duty cycles and owners, exit through scrappage, export, or idling, and the timing of that exit swings with new truck prices, used values, freight demand, and regulation. Because no official agency publishes a “trucks scrapped per year” number, the figures in circulation are estimates built from registration data, sales, survival curves, and trade statistics, and the methodology section above explains how to read them.
For fleet managers, the aging fleet means replacement planning windows are stretching. For owner-operators, it means an old truck’s value depends heavily on when and where it is sold. And for the recycling and dismantling industry, the record volume of 15-plus-year-old equipment on U.S. roads represents a retirement wave that is a matter of when, not if.
Terminology
Scrappage rates are not a constant. They move with new vehicle prices, used values, freight demand, and regulation.
- Truck classes (GVWR). U.S. trucks are grouped by Gross Vehicle Weight Rating into Classes 1 through 8. Classes 1-2 are light trucks (pickups, vans, SUVs). Classes 3-6 are medium-duty trucks (box trucks, delivery trucks, many vocational trucks). Classes 7-8 are heavy-duty trucks, with Class 8 (over 33,000 lbs) covering the familiar semi tractors and heavy straight trucks.
- Retirement. The point at which a vehicle permanently stops being used on the road. Retirement includes scrappage, export, and long-term idling, so it is a broader concept than scrappage alone.
- Scrappage. The permanent physical removal of a vehicle from the fleet, typically through dismantling for parts and recycling of the remaining hulk for scrap metal.
- Scrappage rate. The share of the vehicle population removed from operation in a given year. S&P Global Mobility, which tracks vehicles in operation from state registration records, reported a steady 4.5% annual scrappage rate for U.S. light vehicles in its 2025 analysis.
- Survival rate. The share of a given model year still registered after a given number of years. Plotting survival against vehicle age produces a survival curve, the standard tool for modeling fleet turnover.
- Median lifetime. The age at which half the vehicles of a model year have been scrapped. This is the most common single-number summary of vehicle longevity.
- Vehicles in operation (VIO). The count of vehicles actively registered, the denominator for scrappage rates.
- Downcycling. The common pattern in trucking where a vehicle moves to progressively lighter or slower duty as it ages: for example, from long-haul linehaul work, to regional hauling, to local or vocational use, before final retirement.
Sources
- Davis, S.C. & Boundy, R.G., Transportation Energy Data Book: Edition 40, Oak Ridge National Laboratory / U.S. Department of Energy, 2022. Heavy truck registrations, VMT shares, fuel consumption by truck class (Tables 1.15, 1.17), and heavy truck scrappage and survival rates (Table 3.16). https://tedb.ornl.gov/ (full PDF: https://tedb.ornl.gov/wp-content/uploads/2022/03/TEDB_Ed_40.pdf)
- S&P Global Mobility, “U.S. Vehicle Age Rises Again to 12.8 Years in 2025,” press release, May 21, 2025. Fleet size, average age, and 4.5% scrappage rate. https://press.spglobal.com/2025-05-21-U-S-Vehicle-Age-Rises-Again-to-12-8-Years-in-2025,-According-to-S-P-Global-Mobility
- S&P Global Mobility, “US Commercial Vehicle Market Grew 14 percent in 2023,” press release, February 29, 2024. Commercial vehicle registration growth by class. https://press.spglobal.com/2024-02-29-US-Commercial-Vehicle-Market-Grew-14-percent-in-2023,-according-to-S-P-Global-Mobility
- U.S. Census Bureau, Vehicle Inventory and Use Survey (VIUS) 2021. Truck characteristics, age, and use; first survey since 2002. https://www.census.gov/programs-surveys/vius.html; release announcement: https://census.gov/newsroom/press-releases/2023/vehicle-inventory-and-use.html
- Jacobsen, M.R. & van Benthem, A.A., “Vehicle Scrappage and Gasoline Policy,” American Economic Review. Export share of fleet exits and price elasticity of scrappage. https://econweb.ucsd.edu/~m3jacobs/Jacobsen_and_Van_Benthem_Vehicle_Scrappage.pdf
- Greene, D.L. & Chen, C.K.E., “Scrappage and survival rates of passenger cars and light trucks in the U.S., 1966-1977,” Transportation Research Part A. Median lifetimes of light trucks vs. cars. https://www.sciencedirect.com/science/article/pii/0191260781901448
- Greene, D.L. et al., “Trends in scrappage and survival of U.S. light-duty vehicles,” Transportation Research Part A, 2024. Long-run longevity growth of 0.5-1.5% per year. https://www.sciencedirect.com/science/article/abs/pii/S0965856424000302
- U.S. EPA, Population and Activity of Onroad Vehicles in MOVES3, EPA-420-R-20-023, 2020. Delayed scrappage following the 2008 sales decline; fleet survival modeling. https://www.epa.gov/sites/default/files/2020-11/documents/420r20023.pdf
- Lang Marketing (Lang Aftermarket iReport), via Aftermarket Matters, “Latest vehicle scrappage rate to fuel aftermarket product growth,” 2024. ~11 million vehicles not scrapped 2018-2023. https://www.aftermarketmatters.com/national-news/latest-vehicle-scrappage-rate-fuels-aftermarket-product-growth/
- Automotive Fleet, “Average Age of Vehicles in the US Continues to Rise,” May 2024. Passenger car exits vs. new registrations since 2020. https://www.automotive-fleet.com/news/average-age-of-vehicles-in-the-us-continues-to-rise
- ACT Research, State of the Industry: U.S. Classes 3-8 Used Trucks. Used truck sales, price, mileage, and age indicators. https://www.actresearch.net/reports-data/state-of-the-industry-reports/used-truck-classes-3-8
- NREL, “Heavy-Duty Vehicles Module,” Stochastic Energy Deployment System. Exponential truck survival functions based on ORNL data and VIUS usage curves. https://www.nrel.gov/analysis/seds/heavy-duty-vehicles-module
- FHWA, Highway Statistics (Tables MV-9 and VM-1). State truck registrations and national VMT estimation methodology. https://www.fhwa.dot.gov/policyinformation/statistics.cfm